


Firmographics
Understanding our EDU customers through extensive generative and user research of university org structure, roles and workflows, usability issues and pain points.


Firmographics
UX RESEARCH ON CUSTOMERS
As a customer-facing video management product team, we need to thoroughly understand our customers — who they are, what they do, and their usability issues and pain points. We need to understand the roles and workflows within our customer's organizations in order to better tailor our product design.
Our primary customers are higher education organizations, so the UX design and product team decided to conduct a deep dive into our EDU customers and examine our product from our customers' viewpoints.
TIMELINE
PROCESS SUMMARY
This research endeavor began in June of 2022, beginning with customer interviews and generative research, and it was completed and presented as an informational slide deck to a company-wide audience in January and February of 2023.
Team:
Director of UX Design — Alla Taborisskaya
UX Designers — Amy Zhang, Chris Hughes
Customer Success Expert — Emily Sisk
Our team began by determining the slices of information we wanted to understand by the end of our research cycle, and landed on three phases: firmographics & roles, workflows: what do the customers do?, and usability issues & feature requests. We conducted 36 customer interviews to gather information for our generative research and identify their pain points. After synthesizing the data, we created a series of tables and infographics to represent our findings to present to the entire Panopto team.
SCOPING THE PROJECT
What's the problem?
Panopto does not understand our customer's needs. Before this research endeavor, we had never conducted an organized research effort into understanding the ins and outs of what our customers want and need from our product.

RESEARCH OVERVIEW
The following slides provide a concise, graphic-filled summary into what our team accomplished in our six months of research into our EDU customers.
In order to understand our customers...


.png)
.png)
.png)
.png)
.png)
.png)
WORKFLOWS
We identified the main workflows conducted by all roles across the university by mapping out semester activities in a long table and attributing roles, tasks, and usability issues to each phase.
.png)
.png)
.png)
.png)
.png)
USABILITY ISSUES
A big important piece of our research was identifying their pain points, which involved gathering usability issues and feature requests from our customers through our online forum and direct customer interviews.
.png)
.png)
FIRMOGRAPHICS
Who are our customers?
The first phase of our research was focused on understanding who our customers are and what their organization structure looks like. Previously, we were looking at our product with a Panopto-centric viewpoint. Instead, we need to look at our customer's goals and ask ourselves, where do we fit in?

Classifying our accounts
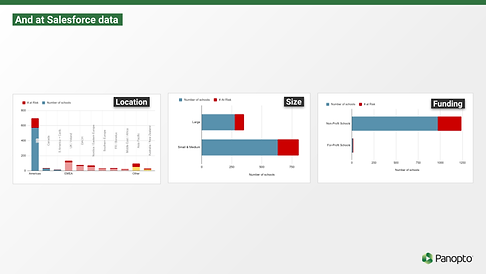
We wanted to identify a way to categorize our customers to better understand what characteristics each of them have. Panopto has a total of 12,032 higher education accounts, which have differences based on location, size, funding types, selectivity, student body, research activity, and special focuses.

1
LOCATION
The timeline, school size, organization structure, use cases, workflows, and priorities vary between different regions.
.png)


KEY FINDINGS
Most of our customers and revenue are located in the United States, so we should focus on their needs in order to retain the most number of accounts.
2
SIZE
We measured school size by FTE, which stands for full time enrollment. Our goal was to find out if orgs of different sizes affected any parameters.


KEY FINDINGS
More individual accounts are located in small/medium orgs.
More revenue per customer is obtained for large orgs.
3
FUNDING + DEGREE TYPES
For funding type, we wanted to find the key differences between non-profit organizations and for-profit ones. We also investigated the types of degrees students can receive.
.png)


KEY FINDINGS
Schools and colleges can exist as independent entities, but at universities they exist as parts of a bigger org. Most of our accounts are with non-profit schools.
4
SELECTIVITY
Schools that are highly ranked are normally also more selective. The rankings are based on educators, instructor student ratio, research opportunities, and awards.
.png)


KEY FINDINGS
High ranking schools carry a lot of weight, even if their FTE is low. Other schools want to use the same technologies as these high-ranked schools, and look to them to set examples.
5
STUDENT BODY
We looked into the division of students and if they were studying domestically or internationally, which affects the degree of remote learning.
.png)


KEY FINDINGS
Local students are more likely to attend classes in person, and students in the same country living far away are most likely to attend classes remotely. Time zones make it difficult for international students to attend synchronous classes remotely.
6
RESEARCH ACTIVITY
The research activity conducted at a university affects which Panopto use cases are used the most.
.png)


KEY FINDINGS
Schools are broken up into R1 and R2 with varying research participation. Schools with high research participation and highly ranked schools tend to correlate.
7
SPECIAL FOCUS
Schools may offer programs, services and activities targeted to the under-represented students they serve.
.png)


KEY FINDINGS
Schools with special focuses could require a higher bar for accessibility for our product, making digital accessibility a big priority.


.png)

.png)


EDU STRUCTURE
Summarizing the university
The next step in our comprehensive research process was to better understand the university structure. This process of diagramming and talking to customers showed us how a university can be broken down into departments, majors, courses, and sections, which is crucial to developing Panopto's departments and subsite structure.
UNIVERSITY OF WASHINGTON
University of Washington is the organization that works with Panopto the most, so we have more data on the structure. We have used it as an example of a typical university in our diagrams.

U of Washington has...


Relationship diagrams
We tested different ways to represent our findings regarding the gradient from faculty to department, the relationship IT has to the rest of the school, etc. We wanted to show all the variations that different schools could have.

Testing diagram styles and colors

SCHOOLS & FACULTIES
In a broader university, there are subdivisions called "schools" or "faculties", which are academic groupings based on subject/field.

DEPARTMENTS
Each school or faculty has departments that are related to the subject matter of the school. For example, the School of Art may have an Art History Department, Theater Department and a Studio Art Department.

DEPARTMENT / SCHOOL
Some smaller faculties are also simultaneously departments if there is only one department that exists under it.

LABS, INSTITUTES, CENTERS, BOARDS
Administrative boards, institutes, interdepartmental programs, centers, and laboratories also conduct academic activity. They can be affiliated with multiple departments as well.

COMPLEX NETWORK
All universities have complex networks of organizations, and each one's web of interconnections looks very different. Here is an example of a more complicated system.

COURSES + SECTIONS
Each department has a number of courses at a variety of levels. Some courses require prerequisites. Each course has a certain number of sections where the professor teachies the same content to a different set of students.

Non-academic departments
Non-academic departments at a school include Information Technology (IT), Audio Visual (AV), libraries, and accessibility. These departments can aid student and instructors to make the teaching & learning process run smoothly.
INFORMATION TECHNOLOGY
The IT department helps students and instructors with technology set-up, computer malfunctions, software installation, and other technological issues.

AUDIO VISUAL (AV)
The AV department helps instructors and students with hardware and equipment related to audio (recording or listening) and video.

LIBRARIES
Libraries hold media like books and video to help students conduct research or complete assignments for class. Schools may have a general library and departmental libraries.

ACCESSIBILITY
Accessibility departments are crucial for an equitable learning experience. They provide students with accomodations such as captions and audio descriptions.

LEARNING TECHNOLOGY
The learning technology department provides instructors with help on how to aid their courses with technology


SMALL SCHOOLS
Small schools may have minimal services and support, and these jobs are performed by instructors, staff, TAs, etc. There are typically only a few people performing this task.
Even small schools will have a university-wide accessibility contact to ensure equitability.
The IT department in this diagram serves only one department, the computer science department.

MEDIUM SCHOOLS
Medium schools may have a centralized resource center, including IT, AV, accessibility, and library services. These departments typically serve the entire university.

LARGE SCHOOLS
Large schools have more resources, meaning both a centralized support center but some faculties and departments may have their own built-in library, IT department, or learning technology center.
Larger schools will have a learning technology department, and potentially learning technologists serving specific faculties or departments.
Purchasing power
It's also important to understand which entities are the ones making the decision on whether to purchase Panopto's services. This purchasing power differs between small, medium, and large schools.

SMALL SCHOOLS
Small schools typically have one license and one account, which means a single URL. An admin in charge of technology at the whole school would be in charge of the license.
MEDIUM SCHOOLS
At a medium org, an individual school or department within an org can purchase a license using their own budget.
This means that fewer students are using it, Panopto has less visibility, and we get less money from this account.
We want to use the “Land and Expand” strategy where an enthusiastic user of our product drives its adoption by other departments.
LARGE SCHOOLS
Larger schools could have multiple Panopto accounts in different levels of the org, with multiple Panopto URLs.
ACTIVITIES AND ROLES
Activities at an EDU
What are the activities that take place at an EDU org? Our team identified primary activities that lead to obtaining a degree, supporting activities, and other activities that students and instructors partake in.

.png)
.png)
1
PRIMARY ACTIVITIES
The primary activities at a university involve teaching & learning, the main activities that lead to obtaining a degree for students.
.png)

TEACHING
Instructors told us about their perspective when it comes to integrating Panopto into their teaching process. Some key findings are that most instructors are not super comfortable with technology and primarily interact with Panopto through the learning management system (LMS) integration.
LEARNING
Students such as Tin Nguyen from Carleton College do not seem to feel the presence of Panopto, but benefit from it as a tool to learn remotely outside of class. Students that serve as TAs are most likely to interact with Panopto more often.

2
SUPPORTING ACTIVITIES
Supporting activities are performed to help the teaching and learning process run smoothly.
.png)
.png)
IT SUPPORT
Out of all the people we interviewed, IT support was the biggest group that we had contact with. They are the primary party to interact with Panopto's video content management system (VCMS) and adjust admin settings like archiving, users, retention, etc.
AV SUPPORT
AV (audio visual) Support manages physical audio and video for the university and provides professional videography and recording services. They tend to prefer Panopto for lecture capture and media conversion, but prefer Zoom for streaming.
.png)
.png)
COURSE PROVISIONING
Course provisioning is the process of scheduling classes, creating folders, scheduling recordings, and setting up permissions. This is typically done by either IT or instructors, and are sometimes done by automated scripts.
ACCESSIBILITY
The accessibility department provides accomodations to students with disabilities to make the learning experience more equitable. This process can differ between schools.
.png)
.png)
VIDEO LICENSING
Video licensing is managed my library media specialists, who have comprehensive knowledge about the media available to students to aid their research, school projects, and assignments.
CURRICULUM DESIGN
Curriculum design can be done by instructors in collaboration with learning technology departments. Instructional designers and technologists can aid instructors in creating an effective course.
.png)


Workflows over time
What do these workflows look like over time? The next step was to examine the timelines of all the activities that these important roles partake in, over a semester, a year, and beyond.

ACCESSIBILITY EVAL
Accessibility operates under a semesterly or yearly evaluation system and the ongoing accessibility support goes for the entire semester.
MASTER COURSES
Master course creation is happening the entire time, its timeline is independent from course loop (other than the due date)
WORKFLOWS
Semester overview
To categorize key workflows, we organized them on a semester timeline by task. Each phase has an aspiration and multiple steps, marked by different roles and an aspiration. This was a key step in understanding our customers and how they work throughout the semester.
ACTIVITIES BY TYPE


USE CASES & OPTIONS
Each step in the table has use cases or options - the phase could be performed in multiple ways.
JOBS TO BE DONE
We noted down all the jobs that need to be performed during each specific phase. The jobs highlighted in green are Panopto-centric tasks.


TIME TABLE
This comprehensive table shows the workflow process from semester start to course completion.


474 SLIDES TOTAL
Use case presentation
We presented our EDU use cases and workflows in a very long and comprehensive slide deck, one that anyone on the Panopto development team can reference in the future to better understand our customers and what they do.

PROCESS
At the end of our research compilation, there were 17 different key workflows divided into 7 different primary categories or phases. Each of these workflows had specific use cases and options, resulting in 59 different deep dives into these use cases.
Firmographics: A summary
The UX design team at Panopto tackled a challenging task together: creating a comprehensive compilation of research that answered the following questions:
Who are our customers?
What is the semester and department structure?
What are the roles and workflows in their organization?
FINAL FINDINGS
Key insights
Through this research process, we learned a lot about who our customers are and what they do. The next step is to figure out how Panopto can step in and make our customers' lives easier.
Here are some key findings that we gathered through talking with customers and customer success advocates.
.png)

.png)
.png)
.png)
.png)
Congrats! You made it to the end of this page.
Hope you enjoyed coming along for the ride, and I truly appreciate you taking the time to check out my work! You can reach me at amyzh425@gmail.com — I'd love to chat with you.